Looking back at five years of Candid’s demographic data collection

Candid is the largest source of data about the demographics of nonprofit leaders, board members, and staff. Between July 2019 and December 2023, over 66,000 nonprofits reported some data about the race/ethnicity, gender identity, sexual orientation, and/or disability status of their leader, board members, and/or staff via Candid’s nonprofit profiles. Here I will share how this data has evolved over the past five years and what this may mean for the future of the data set.
Candid typically shares organizations’ “latest available” demographic data, i.e., their most recent submission. While this is useful to those who want to understand a nonprofit’s current demographic information, it doesn’t tell the story of how the data has changed over the years. For this, we need to dig into Candid’s data archives.i Here are four things we learned from the archival data:
1. More nonprofits are sharing demographic data each year
The number of distinct organizations sharing demographic data with Candid each year has steadily increased, from 3,273 in 2019 to 40,271 in 2023. Put another way, Candid’s latest available data includes 40,271 organizations that shared demographic information in 2023, plus another 25,734 organizations that most recently shared data in an earlier year—for a total of 66,005 organizations.
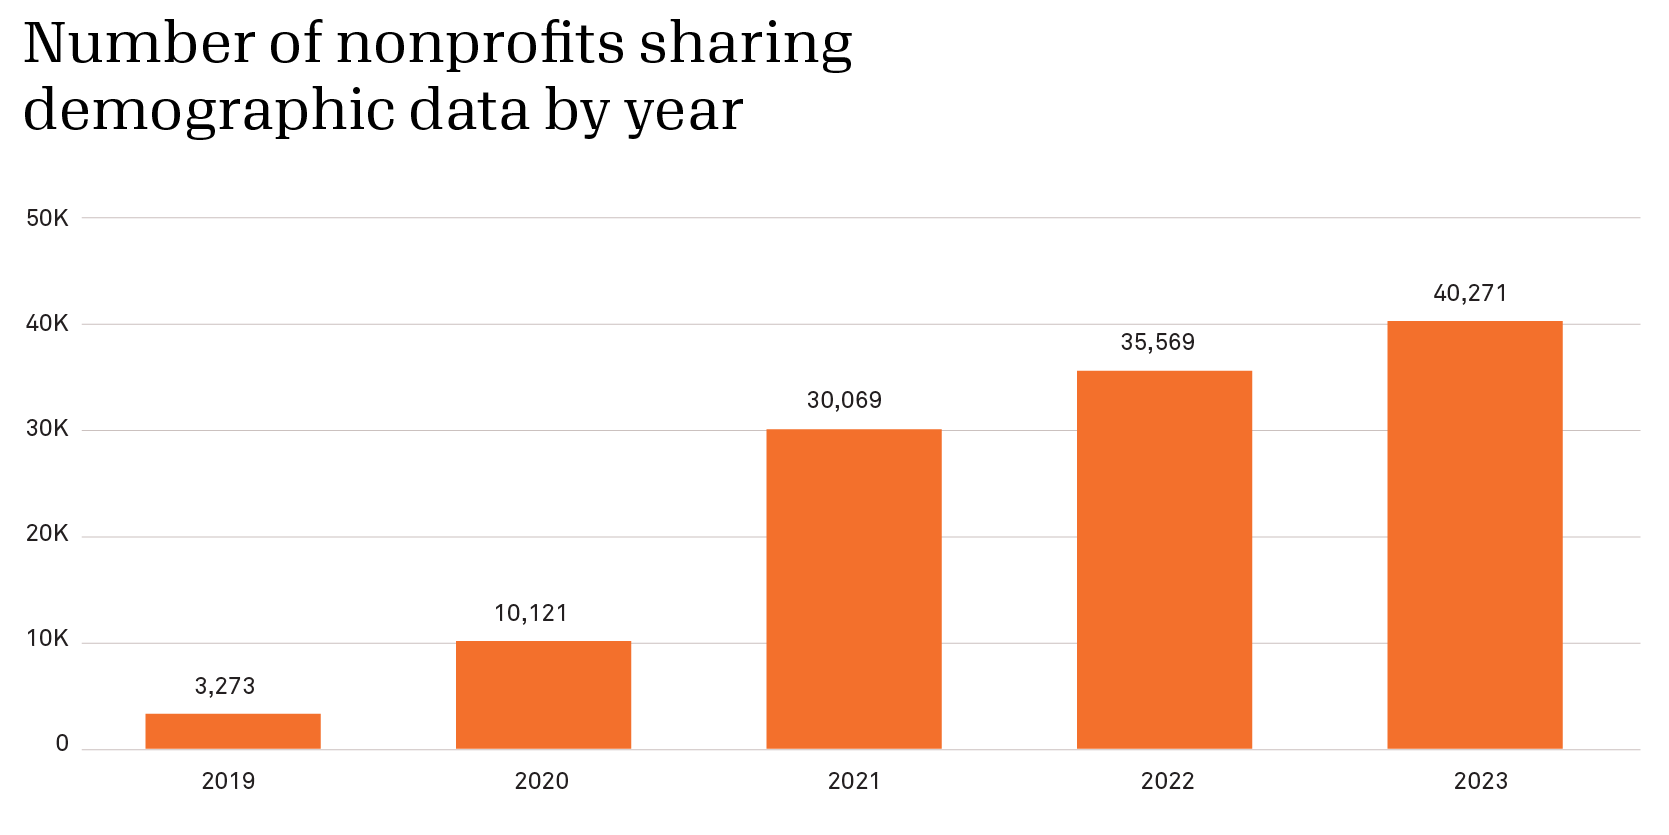
The low figure for 2019 is due in part to the fact that data collection began only in July of that year. Then, in late 2020, Candid made it a requirement for organizations to share, at a minimum, some demographic information about their leader and/or co-leader to receive a Gold Seal of Transparency. This requirement led to a nearly 300% increase in the number of organizations sharing demographic data from 2020 to 2021.
2. Most organizations have updated their demographic data at least once
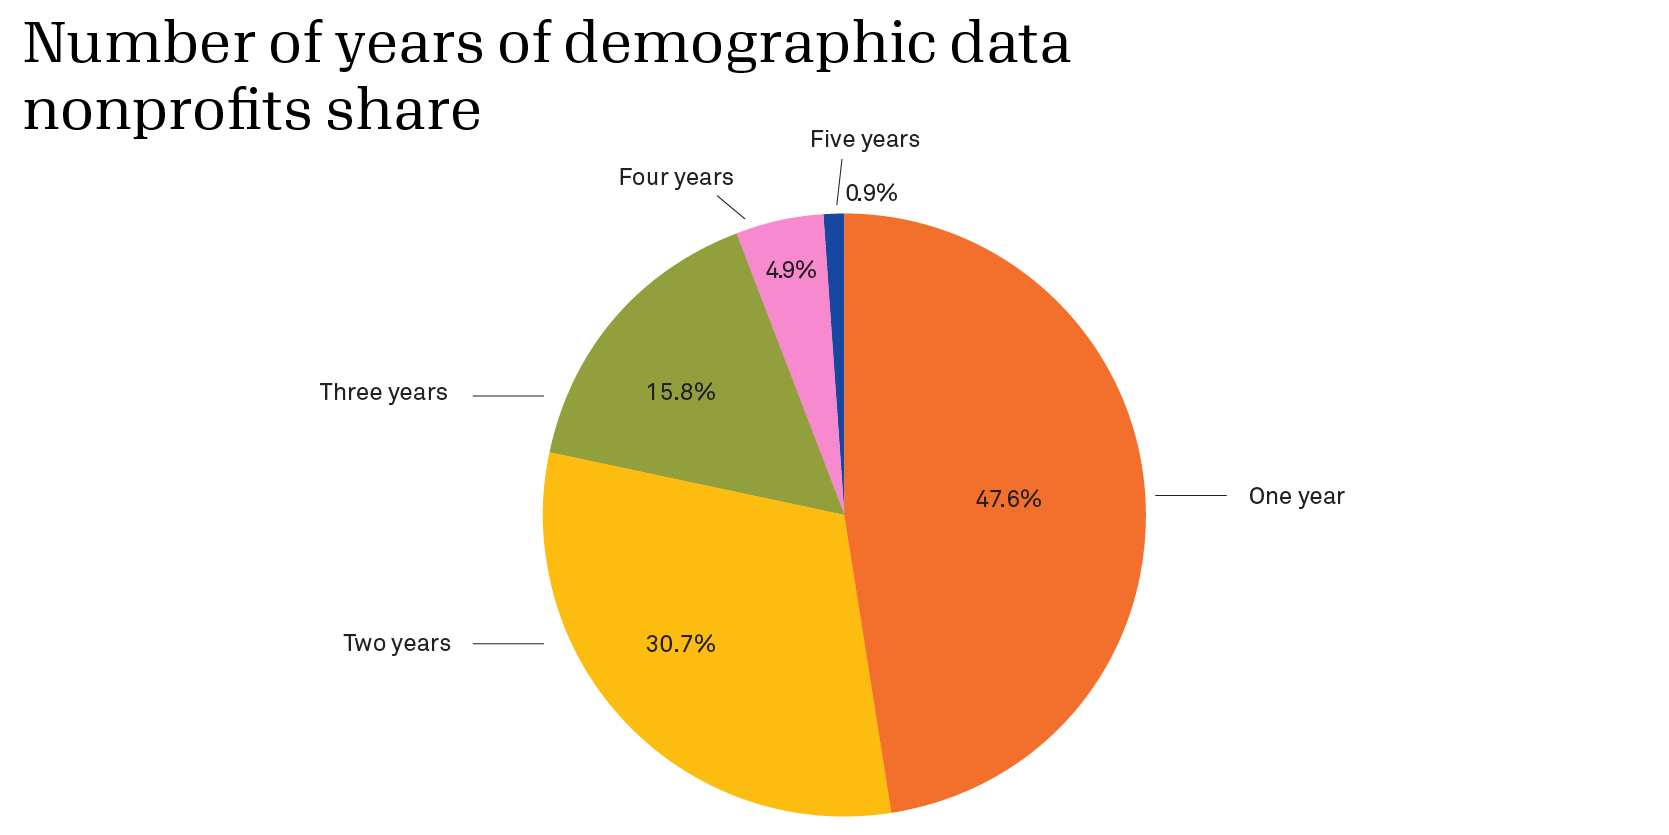
Candid invites nonprofits to update their demographic data every year. This is important because assessing demographic changes over time requires having multiple years of data from nonprofits. Just over half (52%) of nonprofits that have shared demographic information since 2019 have done so more than once.ii It’s exciting that most organizations aren’t taking a “one and done” approach to sharing demographic data with Candid. As Candid continues collecting this information, we expect an increase in the number of organizations providing multiple years of data.
3. Nonprofits are sharing more demographic information each year
Since data sharing is voluntary, organizations can choose what and how much demographic data they share. Generally, nonprofits are more likely to share demographic data about their CEO/executive director(s) than about other staff (probably because sharing data about one or two leaders is easier than sharing data about multiple staff or board members).
Among organizations providing any demographic data, the already high proportion sharing data about their leader(s) went up from 77% in 2019 to 90% in 2023. This increase came largely after Candid made sharing demographic information about their leader(s) a minimum requirement for organizations for the Gold Seal of Transparency. The other demographic categories saw slightly more modest, yet promising, increases. The share of organizations providing board demographic data increased from approximately 54% in 2019 to 63% in 2023; those providing senior leader data increased from 41% in 2019 to 50% in 2023; and those providing data for all staff levels increased from 33% in 2019 to 36% in 2023.
| Staffing level | 2019 | 2020 | 2021 | 2022 | 2023 |
|---|---|---|---|---|---|
| Board | 53.74 | 57.36 | 53.45 | 57.72 | 63.09 |
| Leader | 76.50 | 83.27 | 90.12 | 90.95 | 89.58 |
| Senior Staff | 40.70 | 43.49 | 40.69 | 44.92 | 49.84 |
| Staff | 33.42 | 34.10 | 28.53 | 31.94 | 35.92 |
Limited to the 63,604 nonprofits that shared some demographic data with Candid for any year and did not answer ‘decline to state’ or ‘unknown’ across all questions or skip questions.
4. Nonprofits are sharing more data for each demographic category (though gaps between categories persist)
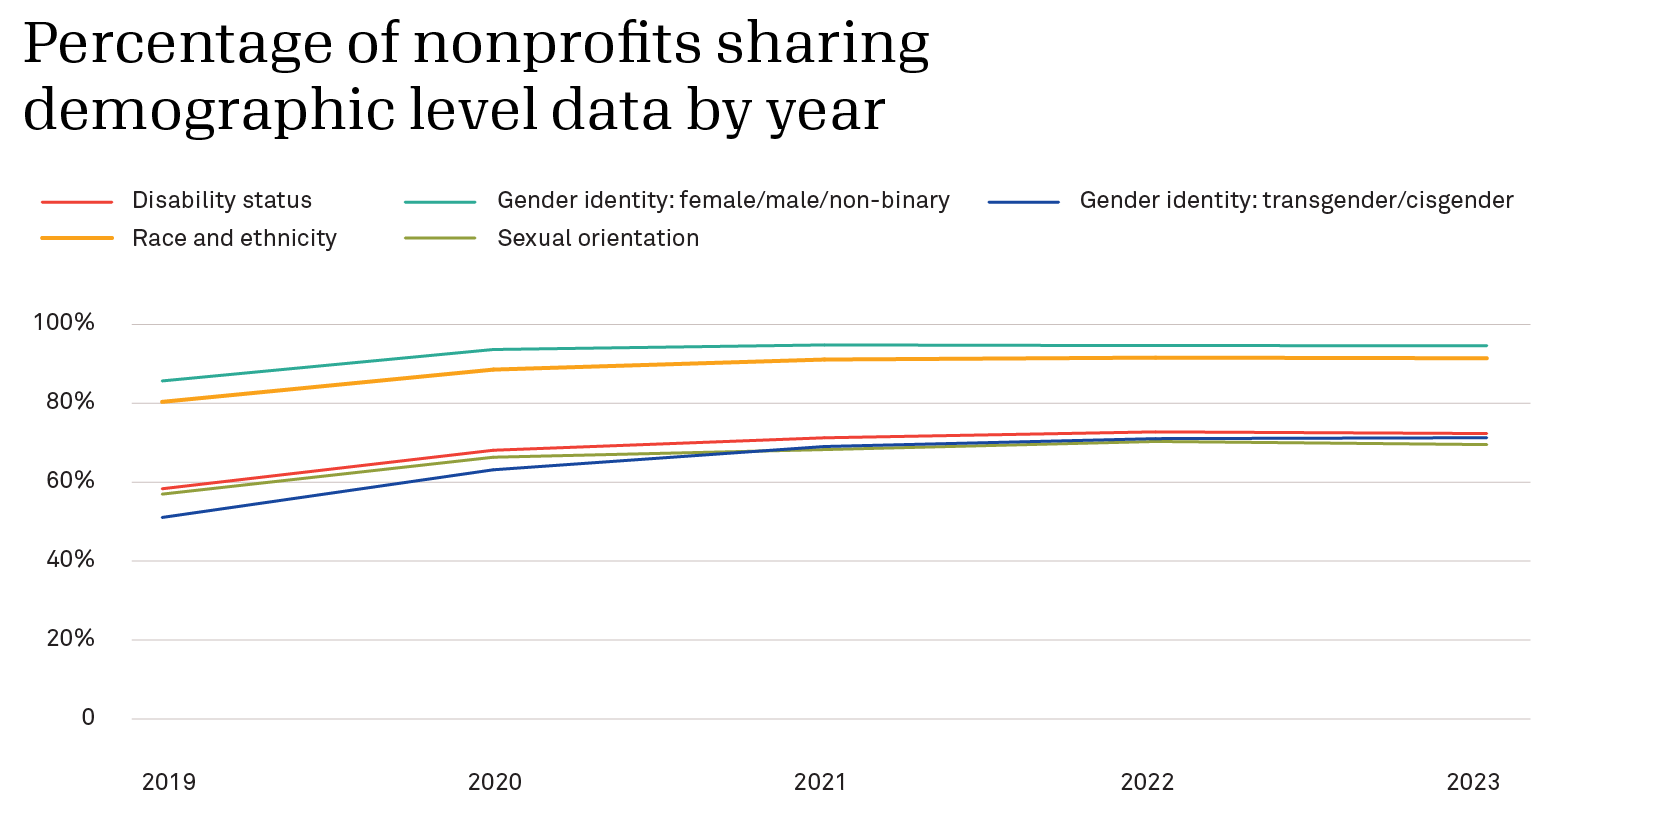
Among organizations providing any demographic data, the percentage sharing data in each demographic category—race/ethnicity, gender, sexual orientation, and/or disability status—generally increased over the five-year period (see chart below). Overall, nonprofits were most likely to share data about female/male/non-binary gender identity followed by race and ethnicity. The categories with the least amount of data were transgender/cisgender identity, sexual orientation, and disability status.
Candid’s demographic data offers a valuable historical record of the leadership and staff of nonprofit organizations. A look at the past five years of data suggests the potential of this data set to enable richer, deeper trend analyses in the future. Each year, we find more organizations sharing more complete data about more demographic categories. As more nonprofits continue to share this information, the more transparency we will have about the makeup and diversity of the sector.
The second article in this series, to be published later this spring, will explore how demographics in the nonprofit sector have evolved since Candid began collecting this data. For example, have there been significant changes in the race/ethnicity of nonprofit CEOs/EDs? Are boards becoming more diverse? Stay tuned.
iThe archival set captures the latest demographic data an organization shared in a given year (i.e., as of December 31). This means that if a nonprofit shared multiple demographic updates in a single year—because, for example, their CEO changed mid-year—the archival set would only include the last update.
iiWe consider an organization to have shared multiple years of data if they re-submit it, regardless of whether those demographics have changed.
About the author

Related posts

Co-leadership: A path to more diverse, sustainable nonprofits?
Dig into insights on nonprofit co-leadership to find out whether this commonplace trend of charitable organizations led by two leaders is opening the door to more overall diversity in the sector.
April 17, 2024

Youth community service: Belonging, reciprocity, and agency
Get insights into how young community service is being redefined by Gen Z and how young people are seeking to maximize their social impact—both for themselves and the communities they serve.
April 16, 2024

Connecting the dots: Fighting for equity through a data partnership
Elizabeth Barajas-Román of WFN shares what a demographic data partnership with Candid enables for advancing equity in the sector, including the first-ever, public dashboard to analyze intersectionality in nonprofit executive leadership.
April 11, 2024

The Maui wildfires: A record in disaster philanthropy, an opportunity to ‘get it right’
CEP’s Tanya Gulliver-Garcia explores funding for Maui wildfires—and what learnings the record-setting response to Hawaii’s recent natural hazard hold for future investment in disaster philanthropy.
April 9, 2024

Collecting demographic data: Nonprofits value transparency but need support
Viewpoint Consulting’s Kelly Brown shares new research findings on sharing demographic data via Candid, including the drivers and barriers of collecting this information to advance nonprofit transparency.
March 28, 2024
What’s trending? Top subject searches in Candid nonprofit profiles
Candid nonprofit profiles help funders, donors, DAF advisors, and others find organizations to support; read this article to learn what supporters searched for most in February 2024.
March 27, 2024
Lael Melville says:
Great meaning ful research in nonprofit space.
I would be interested to know more details about non profit development and successful board engagement