Have grantmaker salaries kept up with inflation?

As the consumer price index rose 9.1% year-over-year in June 2022—the highest rate in over 40 years, according to the Bureau of Labor Statistics—we asked foundations how inflation would affect their operations. In Candid’s 2023 Giving Forecast Survey, 21% of respondents said inflation affected their grantmaking decisions in 2022, and 29% expected it to affect their grantmaking in 2023.
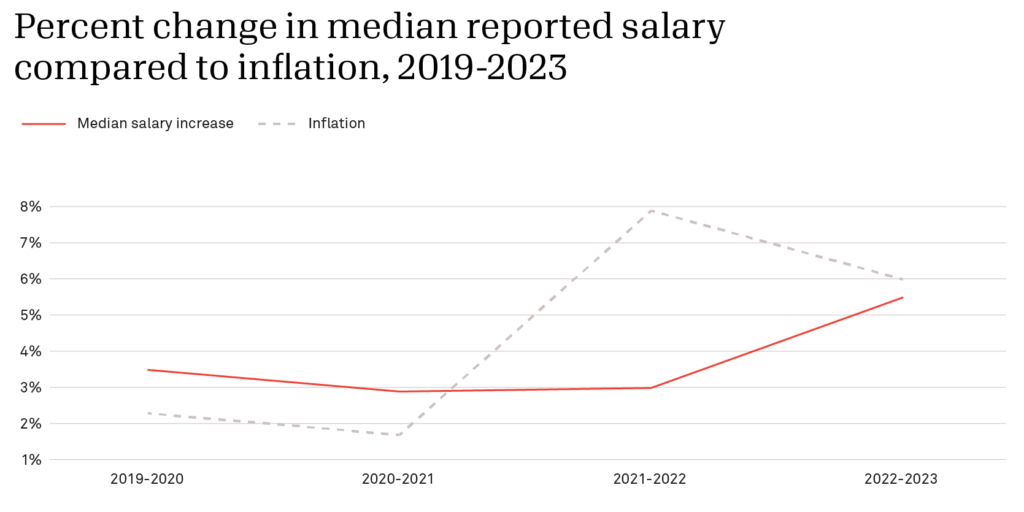
But what about the implications for foundation staff? The Council on Foundations’ 2023 Grantmaker Salary and Benefits Report Key Findings (for which Candid provided data analysis) offer a broad picture: Median full-time staff salaries for select roles rose 5.49% between 2022 and 2023, i as reported by a non-representative panel of 514 grantmaking organizations.
We cannot draw a causal link between inflation rates and salary increases, but using Council on Foundations data, we can further explore how they change over the same time period. We should note that annual salary changes may not coincide with or immediately follow changes in inflation rates, given that salary review processes take time. Still, 5.49% is not too far behind the estimated overall inflation rate of 6.0% from February 2022 to February 2023. As seen in the graph below, the gap is far narrower than between 2021 and 2022, when median grantmaker salaries rose by about 3%, even as inflation surged to nearly 8%.ii
Salary growth has been slow at community foundations
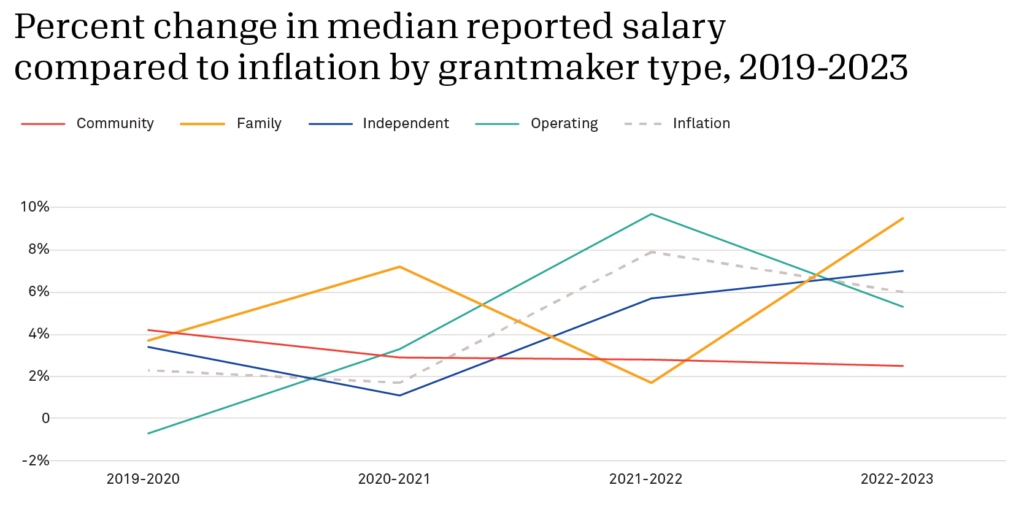
There are significant variations, however, between different types of grantmaking organizations in how much and how quickly salaries have gone up.iii Rates of increase at independent and operating foundations generally followed a path parallel to that of overall inflation rates. By contrast, salary increases at family foundations showed an inverse pattern to inflation, falling as inflation soared in 2021-2022 and rising to 9.5% in 2022-2023, well above inflation and all other grantmaker categories. Meanwhile, salaries at community foundations have risen at a slightly lower rate with each consecutive year. This could be related to the fact that community foundations rely on public support and may face greater pressure to limit overhead costs. But without more information from decision makers at those organizations, we can only speculate.
Salaries across regions increased at rates near or above inflation in 2023
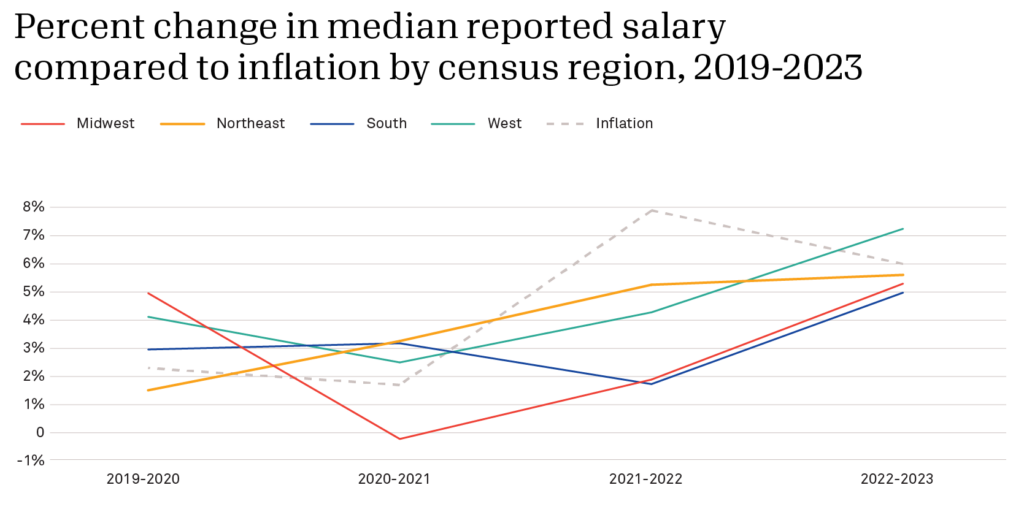
Broken out by census region, rates of salary increases at organizations in the Midwest, Northeast, and South all rose just behind inflation between 2022 and 2023. Median salary in the West rose by more than 7% in that time, outpacing inflation.
Research directors saw the largest salary increases in 2023
Which individual full-time staff rolesiv saw the largest median salary increases? While it may be reasonable to assume they’d be at the top of the organizational chart, the survey results suggest that isn’t the case. In terms of percent increases in median salary between 2022 and 2023, the CEO role doesn’t crack the top 10.
| Full-time employee roles with the largest median salary percent change, 2022-2023 | ||
| Role | 2022-2023 Median Salary Increase (%) |
No. of Grantmakers Reporting |
|---|---|---|
| Research Director | 14.55% | 32 |
| Grants Management Assistant | 13.28% | 65 |
| Research Associate | 11.07% | 31 |
| Controller | 10.12% | 168 |
| General Counsel | 9.41% | 26 |
| Chief Financial Officer/Treasurer | 8.18% | 224 |
| Assistant Treasurer | 8.13% | 17 |
| Vice President (Programs) | 7.16% | 166 |
| Executive Assistant | 6.65% | 157 |
| Program Assistant | 6.41% | 88 |
At the other end of the list, directors and senior professional staff have seen smaller increases in median salaries. While a few roles such as grants manager/administrator, associate director or executive vice president, and program director have seen their median salaries drop, these dips are likely due to staffing or reporting changes rather than actual reductions in individuals’ salaries.
| Full-time employee roles with the smallest median salary percent change, 2022-2023 | ||
| Role | 2022-2023 Median Salary Increase (%) |
No. of Grantmakers Reporting |
|---|---|---|
| Program Director | -3.15% | 180 |
| Associate Director, Executive Vice President | -2.10% | 78 |
| Grants Manager/Administrator | -0.22% | 184 |
| Senior Program Officer | 0.84% | 165 |
| Technology Professional | 0.87% | 56 |
| Vice President/Chief Development/Advancement Officer | 1.26% | 102 |
| Director of Human Resources | 1.44% | 41 |
| Director of Donor Services/Donor Services Officer | 1.45% | 91 |
| Director of Impact Investing | 2.17% | 27 |
| Accountant | 2.52% | 146 |
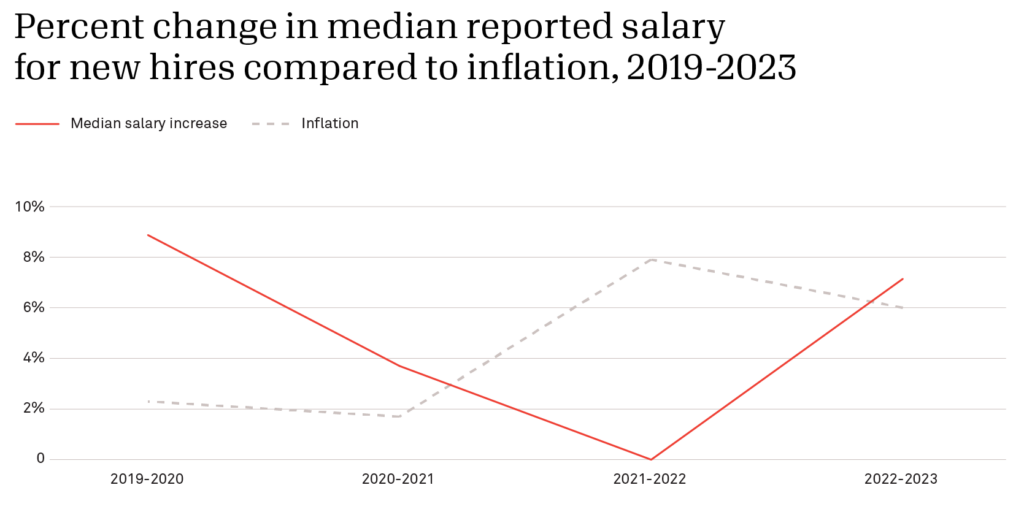
Finally, given how volatile the labor market has been over the last few years, what can we say about starting salaries offered by foundations? We can use salaries for new hires—those with less than one year of reported tenure within a given organization—as a proxy for what foundations are offering to attract new talent. While median starting salary increases outpaced inflation between 2019 and 2021, they fell to 0% in 2022. They’ve since swung back and landed just ahead of the inflation rate in 2023.
Salary increases are affected by many factors, not just economic conditions. Factors like individual performance, changes to employee benefits, and salary competition cannot be controlled for in these data. In addition, this analysis does not take into account scenarios such as staff turnover or internal promotions which can lead to salaries for specific roles changing, though the use of the median value should help mitigate these effects.
While we cannot know for certain whether the spike in inflation in 2022 was a driving factor in how salary increases were calculated for 2023, we can observe an overall increase in the median full-time grantmaker salaries that came fairly close to matching the overall pace of change in consumer price.
With economic indicators likely to be in the news throughout the year, we’ll be curious to see what kinds of changes are revealed by this year’s Council on Foundation’s Grantmaker Salary and Benefits survey, slated to launch in March.
iBased on responses from 514 grantmaking organizations that responded to the last five surveys. Salary increase calculations based on reported values of February of each calendar year. While the survey requests these annual salary equivalents, the survey also asks respondents to estimate the average increase for all staff in the survey year. All respondents to the 2023 survey reported a median of 5% in expected salary increases for 2023 across all positions, which aligns with what we’re seeing at the individual full-time role level.
iiThe salary information in all charts and tables are based on responses to the annual Council on Foundations’ Grantmaker Salary and Benefits surveys between 2019 and 2023; values are yearly equivalent pay as of February of the year in which the survey was fielded. Inflation rates are based on the U.S. Bureau of Labor Statistics’ Consumer Price Index calculations for the 12-month period between February of each year.
iiiThis section intentionally excludes corporate, public, and “other” grantmaker types for which there were fewer than 20 organizations responding across all five years included in this analysis.
ivFor the list of staff positions which have been identified as commonly found among grantmakers, see this PDF from the Council on Foundations. Participating organizations may have staff who fall outside of the listed roles; these excluded staff salaries may affect the increase percentages above, but without supplemental information we cannot suggest directionality.
Photo credit: shapechange via Getty Images
About the author

Related posts

Community foundations: Donor-advised fund grants outpaced contributions in 2022
Find out how donor-advised fund grants given compared to DAF contributions among community foundations in 2022–and what research on this trend may mean for philanthropic giving in the future.
April 23, 2024

Co-leadership: A path to more diverse, sustainable nonprofits?
Dig into insights on nonprofit co-leadership to find out whether this commonplace trend of charitable organizations led by two leaders is opening the door to more overall diversity in the sector.
April 17, 2024

Youth community service: Belonging, reciprocity, and agency
Get insights into how young community service is being redefined by Gen Z and how young people are seeking to maximize their social impact—both for themselves and the communities they serve.
April 16, 2024

Connecting the dots: Fighting for equity through a data partnership
Elizabeth Barajas-Román of WFN shares what a demographic data partnership with Candid enables for advancing equity in the sector, including the first-ever, public dashboard to analyze intersectionality in nonprofit executive leadership.
April 11, 2024

The Maui wildfires: A record in disaster philanthropy, an opportunity to ‘get it right’
CEP’s Tanya Gulliver-Garcia explores funding for Maui wildfires—and what learnings the record-setting response to Hawaii’s recent natural hazard hold for future investment in disaster philanthropy.
April 9, 2024

Collecting demographic data: Nonprofits value transparency but need support
Viewpoint Consulting’s Kelly Brown shares new research findings on sharing demographic data via Candid, including the drivers and barriers of collecting this information to advance nonprofit transparency.
March 28, 2024