Building institutional capacity, without breaking the bank

Institutional capacity is your organization’s ability to get work done—to reach its goals. The process of improving that capacity is often thought of in terms resources: finding more funding and increasing staff. Unfortunately, this direct approach is hard to accomplish.
Fortunately, it is also possible to improve institutional capacity by building management and communication skills. Organizations often rely on training and team building to strengthen these areas. Regretfully, these tactics usually don’t have as much impact as we hope. So instead, in this article, we’re going to look at a new way: a Practical Mapping approach.
About Practical Mapping
Practical Mapping allows you to better understand your organization so that you can apply your resources more efficiently. It has been explored in an award-winning paper, a textbook from Sage, and a recent research paper based on a Fulbright project.
A Practical Map is similar to a road map. A road map has many dots corresponding to actual places in the real world, giving you more options on where to go. It also has many roads connecting the dots, giving you, as the driver, many options on how to get there.
Developing a Practical Map for your organization
For understanding your organization, a Practical Map includes many concepts relating to your operations. These concepts are measurable in the real world: number of volunteers, number of clients served, etc.
Just having dots on your map, however, can cause problems. Imagine you are on a road trip across the country. What if you have a map with many interesting places, but the map does not show the roads? Each person on the trip is concerned only the destination they want most.

Many organizations face this problem. Each manager and supervisor is pulling in a different direction. Each is seeking to acquire the most resources possible for their part of the operation, without understanding the whole picture. They are good and wonderful people, but they are focusing a little too much on their “local” goals.
Too often, we have wonderful people arguing over terrible maps.
So, in addition to showing many concepts for your organization, your Practical Map should also show connections between them. Where a road map has lines, a Practical Map has arrows representing causal relationships between concepts. The arrows show how changes in one thing cause changes in another. For example, “More good publicity causes more volunteers to join us.”
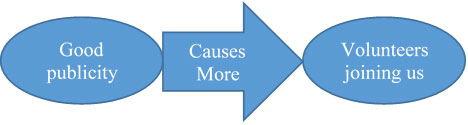
When your map includes concepts and causal arrows, it provides a more practical guide for actions to take. For example, the above (very simplistic and incomplete) Practical Map shows a clear path for gaining volunteers. No confusion or conflict there.
There is a lot that might be said about the process of creating your Practical Map. For the moment, let’s just say that the maps are best made in collaboration with a wide range of stakeholders, and with the help of a knowledgeable facilitator.
The next step: loops
After you develop a Practical Map with many concepts and causal arrows, the next step is to find or create loops. The loops will help you make better decisions in the allocation of scarce resources. For example, let’s build on the above relationship between publicity and volunteers to suggest a loop.
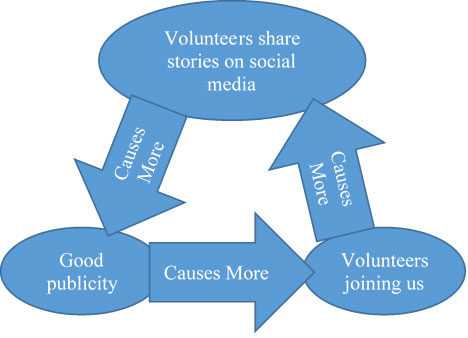
Notice how the activity in each circle causes improvements in the others. The more that you can find and support positive loops of this kind, the more your activities can improve over time.
(As a sidenote, if you are not able to find these kinds of loops in your organization, it may be possible to shift activities and responsibilities toward new tasks.)
Note how no one part of this loop is more important than another. The backseat drivers could argue forever about where on the loop to focus your resources. So, we look for multiple loops.
Below is a map with two loops that represents concepts with letters. We find this approach helps people to focus on the structure of the relationships, rather than the concepts (which, after all, will be different for each organization).
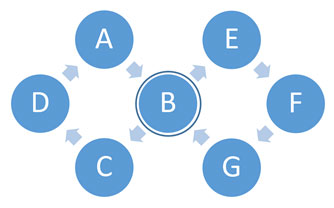
As you develop multiple loops for you map, look for those few concepts that are a part of two (or more) loops. Those are your leverage points. For example, in the figure above, B is the leverage point at the overlap between two loops. Placing your resources on B will support and sustain activities in two loops—giving you the greatest result for the least cost.
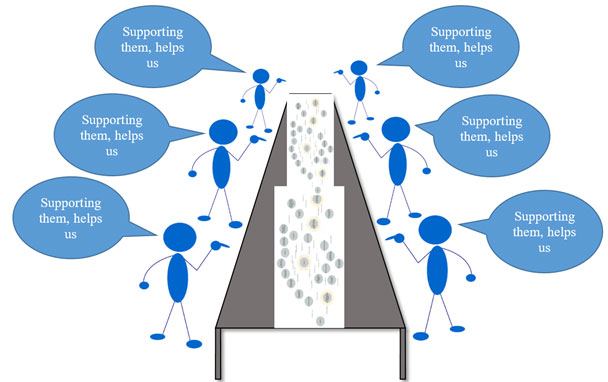
Creating a Practical Map with many loops can help guide your use of limited resources and guide others in the organization toward supporting each other—for the benefit of all.
In our experience, people who create and use Practical Maps are able to reach sustainable collaborative agreements very quickly. They avoid narrow views that lead to endless arguments.
This makes for a much more enjoyable road trip and higher institutional capacity.
About the author

Related posts

Grants prospecting strategy 101
Learn best practices for creating a funder prospecting strategy to help you secure grants to support your nonprofit’s mission-driven work.
April 15, 2024

Visibility and relationships: Effective fundraising for small nonprofits
Candid’s senior development manager shares tips, tactics, and strategies for effective fundraising to help smaller nonprofits find, win, and retain grant funding.
April 2, 2024

Mitigating future risks: Why your organization should have an AI policy
Find out three reasons why having an AI policy can help maximize the benefits of new technology while minimizing the risks for organizations seeking to make a social impact.
April 1, 2024

Is your nonprofit organization ‘grant-ready’?
Seeking a grant for the first time? Here’s how to make sure your nonprofit is prepared to receive foundation grant funding and what you can expect funders will require in the process.
March 25, 2024

How to tell a compelling story with a Seal of Transparency
If you’re wondering what a Seal of Transparency is, how to earn a 2024 Seal, the benefits of doing so, and more, this article answers nonprofits’ top questions about Candid Seals.
March 19, 2024

Rethink, reuse, and repurpose: How to create more social media content with less work
Candid’s senior manager of digital communications explains how you can repurpose social media content to save you time and work when engaging your nonprofit’s online community.
March 14, 2024