How America gives: Who funds what causes and where?

According to 2023 IRS data, there are about 1.9 million registered nonprofits in the United States vying for charitable giving from individual donors and institutional grantmakers. What do we know about the causes and states each type of funding flows to and the factors that affect giving trends?
In this article, we highlight key insights from our report, Dollars and Change: A Look at Individual and Institutional Giving Across the United States From 2015 to 2022, which combines data from Candid, GivingTuesday, and Network for Good.
Who gives to what causes?
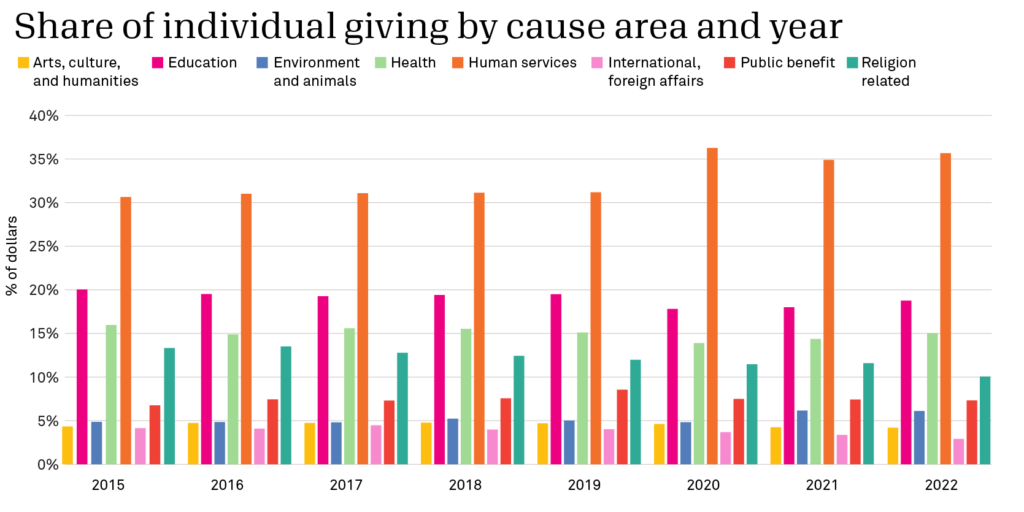
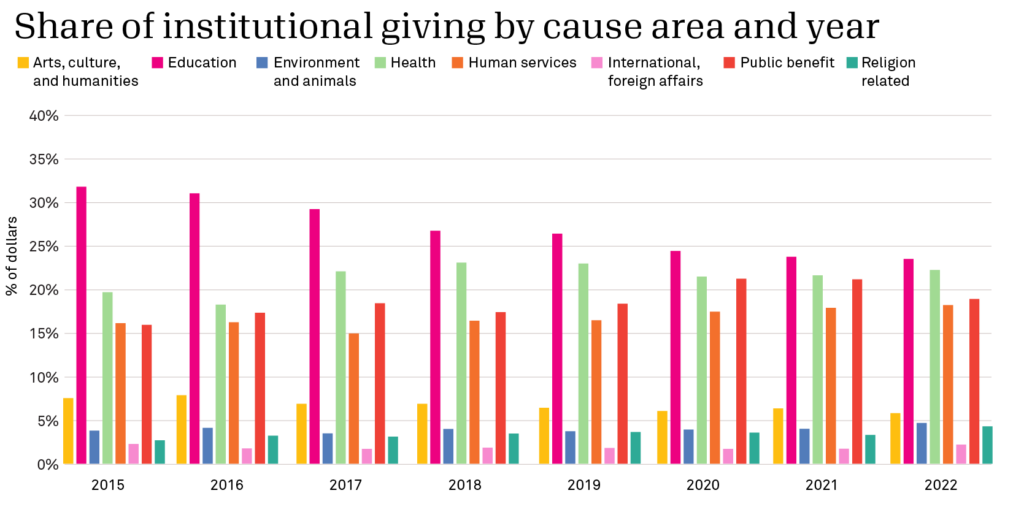
Both individual and institutional giving increased between 2015 and 2022, not only in terms of total dollars awarded but also in terms of average donation or grant size. There are marked differences, however, in the causes individual donors and institutional grantmakers prioritize. Each year, the largest share of individual giving supported human services organizations (including organizations providing essential services like food and shelter)—on average 33% of total individual giving, compared with 14% of total institutional grant dollars. By contrast, the largest share of institutional grant dollars supported education—on average 27%, compared with 19% of total individual giving.
At the same time, the data reveals a downward trend in the share of dollars going to education, especially from institutional funders. This shift may reflect changing priorities or an increased focus on other pressing issues like public health and social services.
The report also found that while most individuals make donations of $100 or less and most grantmakers award grants of $100,000 or less, the bulk of charitable funding comes from a small group of donors and grantmakers making large contributions.
Where do the dollars go?
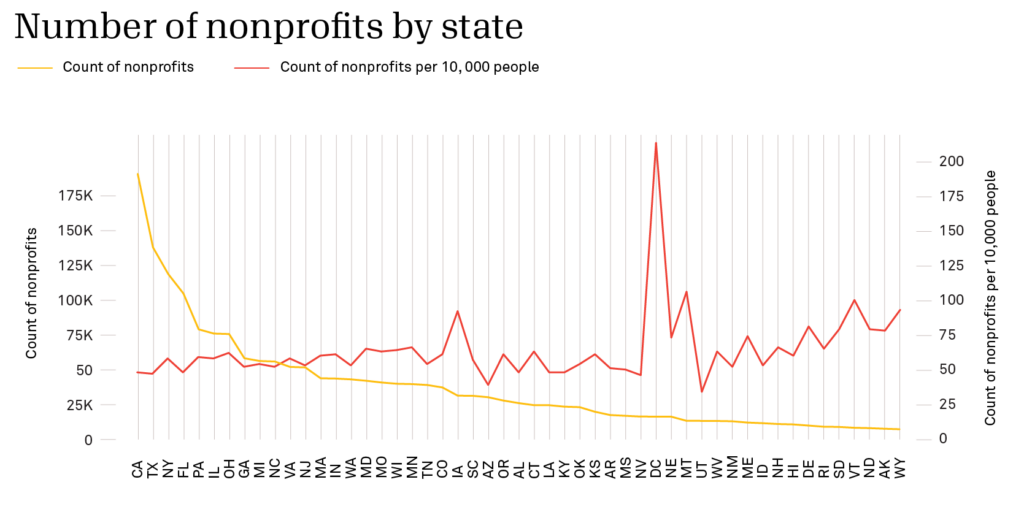
Philanthropic dollars are not evenly distributed across the U.S. but concentrated among few states. California, New York, Florida, and Texas—which have the most nonprofits and the biggest populations—consistently receive the most in terms of total dollars, individual giving and institutional grants combined. When adjusted for population, however, Washington, D.C., receives far more charitable dollars per capita than any other state, followed by Nebraska. This suggests that certain areas, despite having smaller populations, have a thriving nonprofit sector.
Overall, states with higher median household incomes tend to receive more charitable donations. Conversely, states with higher poverty levels receive less, raising important questions about how equitable current methods of philanthropic distribution are.
The economy’s role in individual giving and institutional grantmaking
There is a strong correlation between the health of the U.S. economy and the amount of money flowing into the nonprofit sector. Specifically, factors such as household savings, disposable income, and especially stock market performance are strong predictors of overall giving.
Inflation, however, has more of an immediate impact on institutional grantmaking than on individual giving. The data suggests institutional grantmakers may increase their giving to account for rising costs more often than individual donors. The largest donors, both individual and institutional, are the most sensitive to economic conditions.
Looking ahead
The report is a call to action for donors, nonprofits, and researchers to work toward a more equitable philanthropic sector. Its findings raise important questions for future research. Why is funding to the education sector not keeping pace with other sectors, and what are the implications for education nonprofits? How can philanthropy better support states with higher poverty levels and lower household incomes? It’s crucial to continue monitoring these trends and explore new ways to address disparities in philanthropic distribution.
About the authors


Related posts

Foundation giving remained steady in 2023. What’s the outlook for 2024?
What could foundation giving in 2023 mean for giving to nonprofits this year? Find out by delving into Candid’s analysis of last year’s foundation giving and payout data, including what changes to expect in grantmaking in 2024.
June 12, 2024

5 takeaways from the Fundraising Effectiveness Project’s 2023 data
Dig into the Fundraising the Fundraising Effectiveness Project’s 2023 data to discover five key takeaways, including a decline in the number of donors and donation dollars raised, and what they may signal for nonprofits in 2024.
May 22, 2024

Foundation giving and payout in 2022: What changed and what’s next?
Discover key insights into how foundation giving and payout changed last year and what these shifts may signal for 2023.
June 29, 2023

Expert tips for nonprofit fundraising success
To achieve more nonprofit fundraising success, check out Candid’s how-to articles, free resources, data-driven insights, and expert tips to help you boost individual giving, tap into grant funding, and more.
August 15, 2024

Community foundations: Resilience in tough economic times
Council of Foundations’ David Rosado highlights key CF insights report findings on community foundations in 2022, including what changes in the growth of their assets and grantmaking may signal for today.
March 21, 2024

Fundraising beyond GivingTuesday: 5 tips to maximize year end giving
Feeling the post-GivingTuesday blues? Find out why now is not the time to give up on year end giving and discover five ways to maximize your fundraising success this giving season.
November 30, 2022
NORMA MILTON says:
Very interesting. Great facts. I love the breakdown and facts. Very helpful.