Toward transparent metrics

What we can learn about nonprofit results from Platinum Seal holders? How do nonprofits measure success? How do they know they’re making a difference? Questions about the nonprofit sector’s impact and effectiveness abound—and are inordinately hard to answer. But one source for answering these questions resides in transparent metrics and data provided by GuideStar Platinum Seal holders.
More than 12,000 nonprofits are committed to Candid’s highest level of transparency and have earned a GuideStar Platinum Seal. In addition to communicating their mission and strategies and disclosing financial information, these nonprofits share quantitative data about their progress and results (such as how many program participants gained employment or reported improved health indicators). Organizations have shared more than 43,000 metrics, which demonstrate how nonprofits measure the difference they make in the world.
Who shares their metrics?
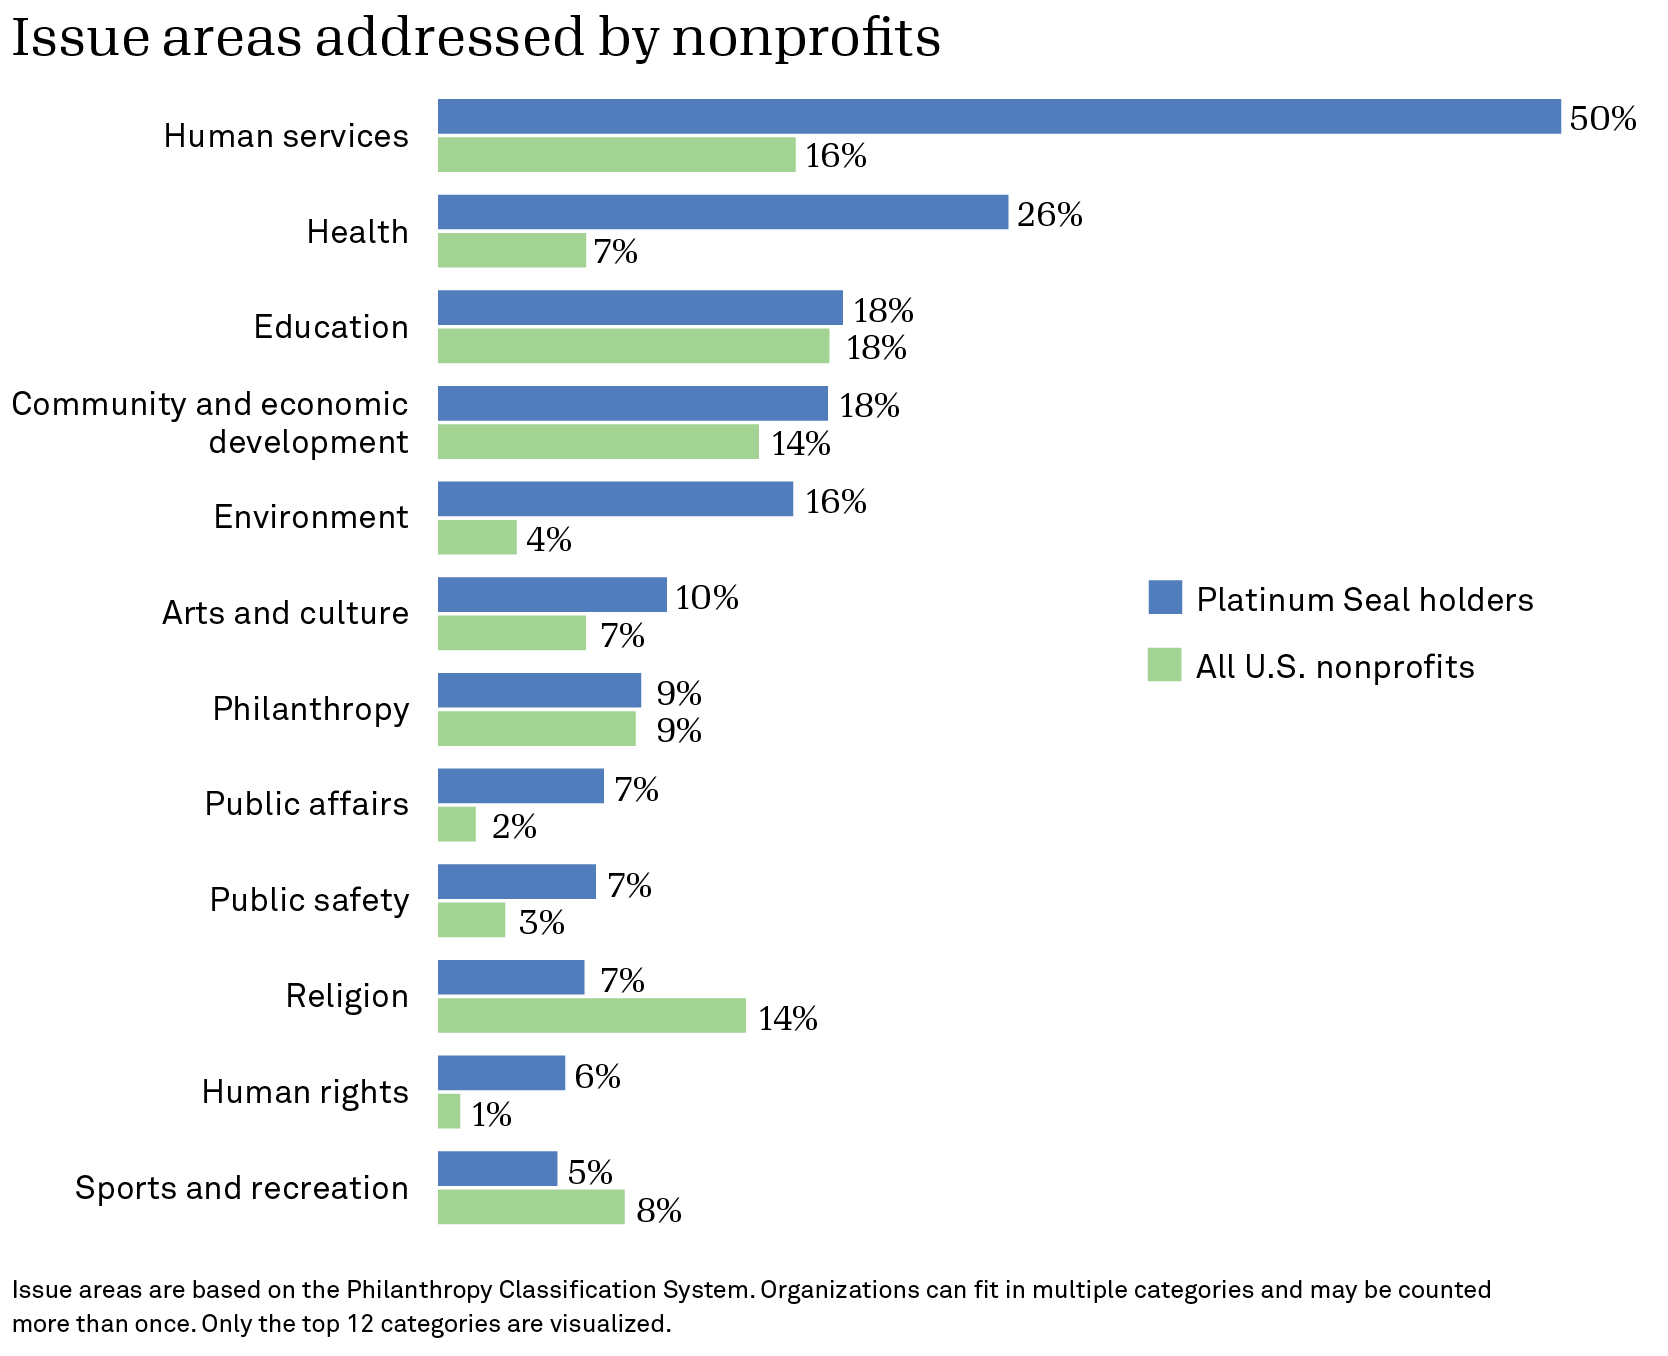
Platinum Seal holders address a diverse range of issue areas. Half are engaged in human services, compared to 16 percent of the general nonprofit population. Platinum Seal holders are also far more likely than nonprofits overall to work in the areas of health and the environment. Religious organizations are less likely to be Platinum Seal holders, although they make up the fourth largest category among all nonprofits.
What kinds of metrics are shared?
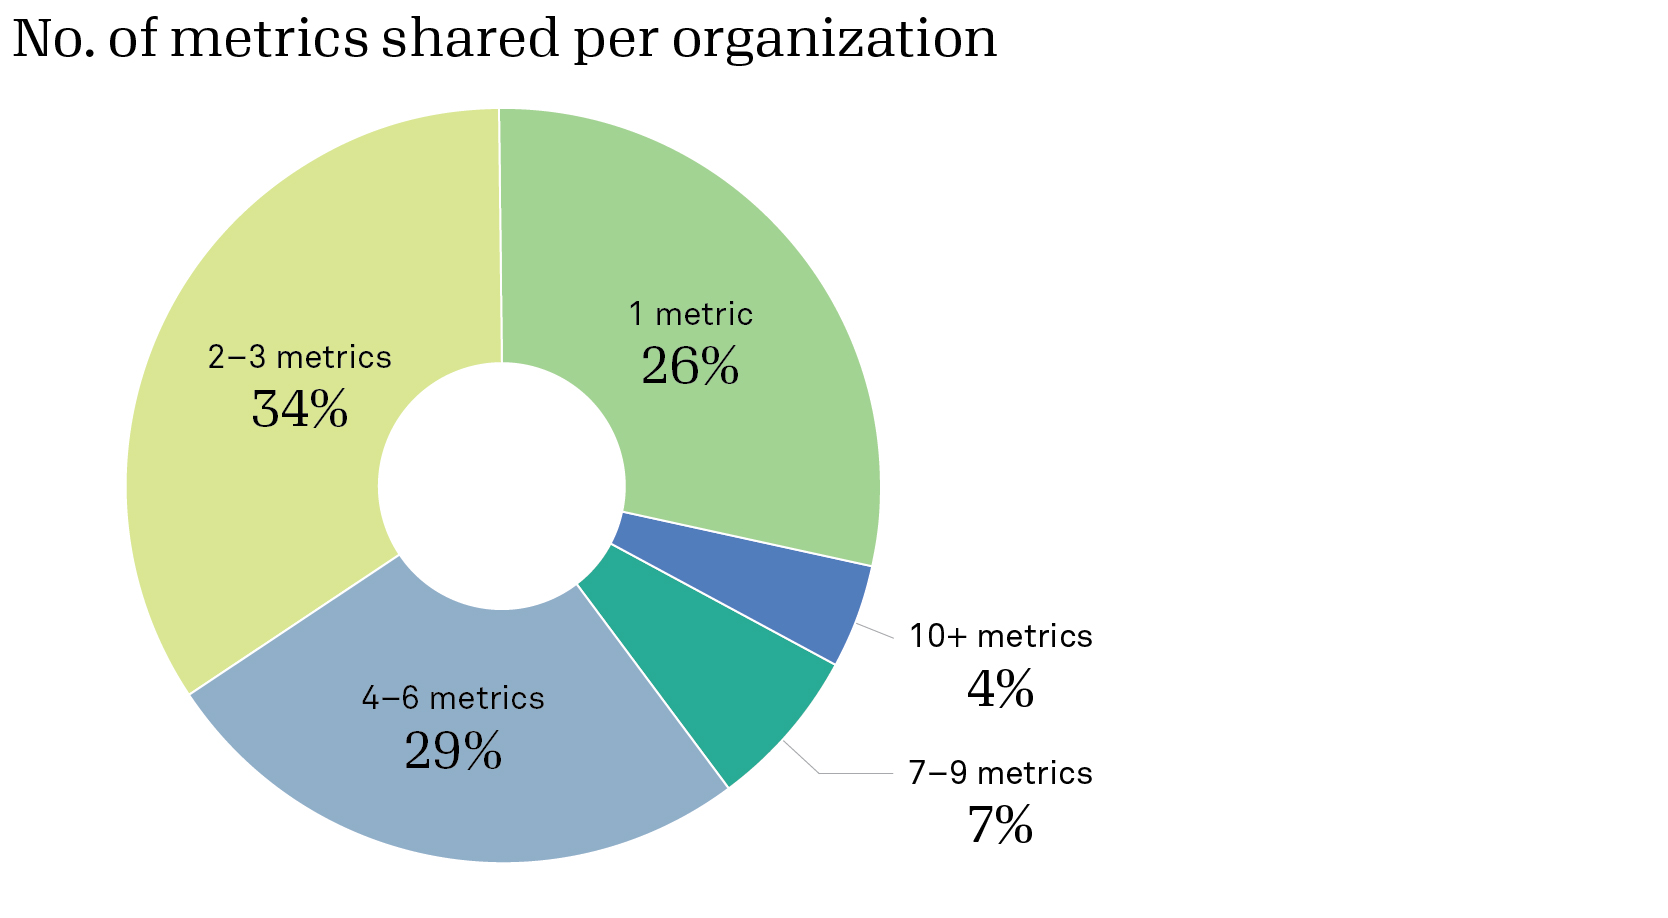
Platinum Seal holders provide, on average, three metrics. About a quarter of organizations share just one metric, the minimum requirement. Organizations typically report four years of data per metric.
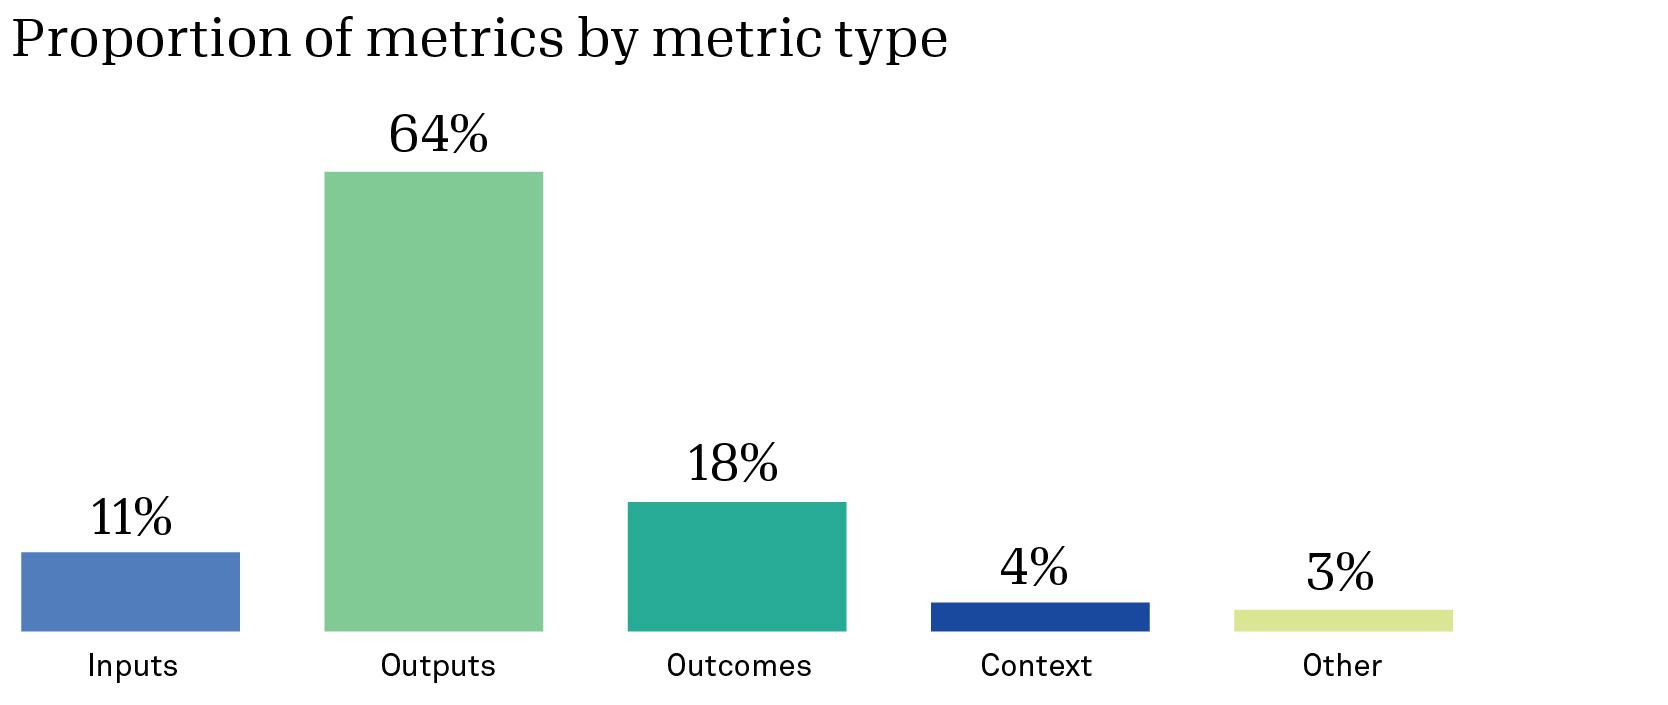
Most metrics are outputs (64 percent); 18 percent are outcomes. Nonprofits can categorize their metrics as inputs, outputs, outcomes, context, or other (for those that fall outside these categories). Each is an important part of an organization’s story.
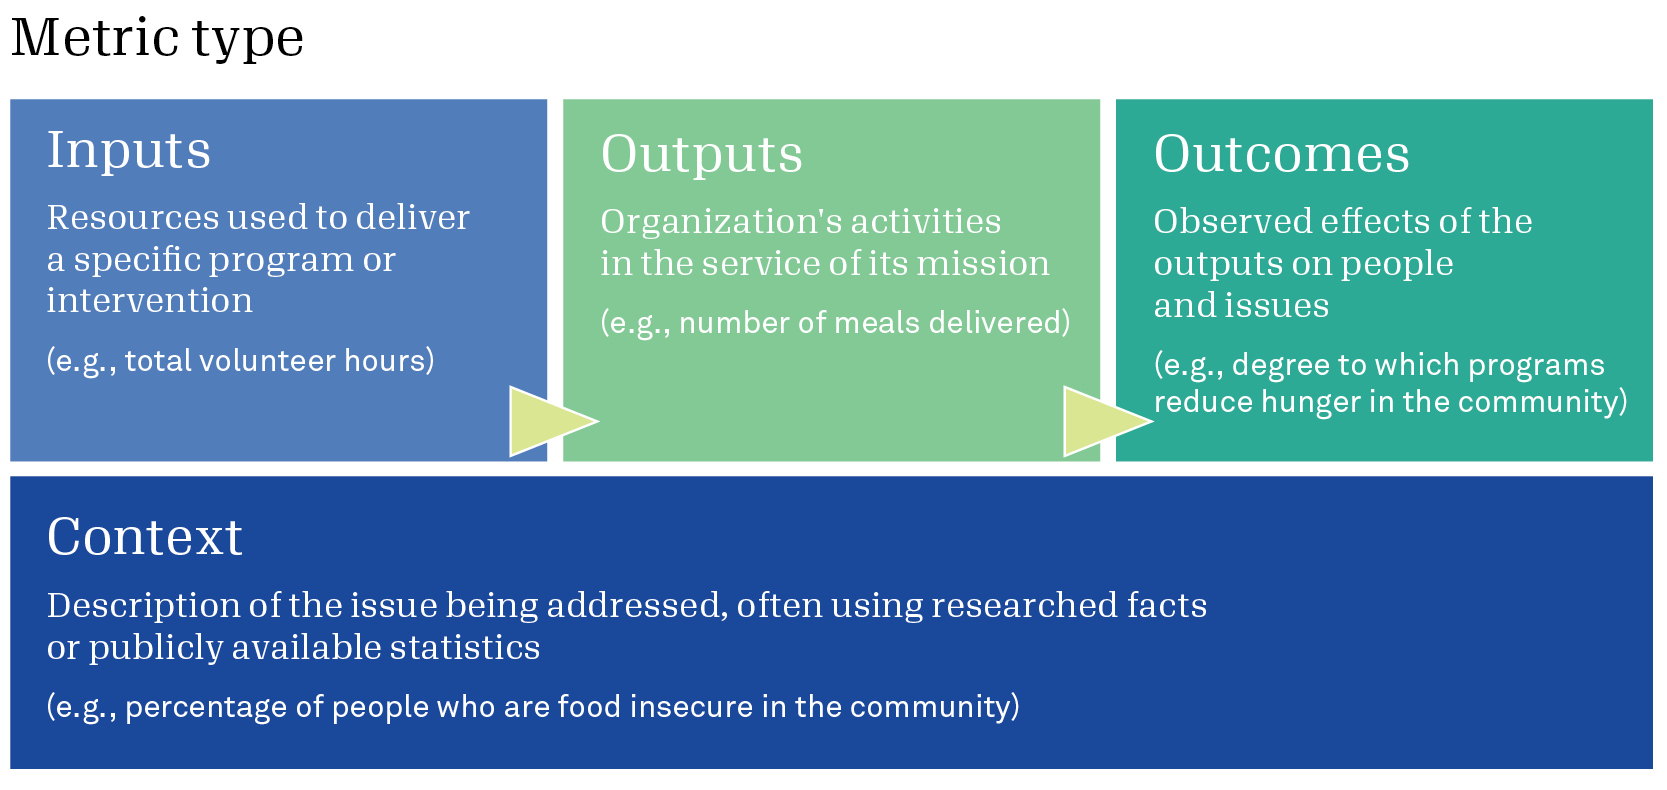
The majority of metrics are outputs, describing an organization’s activities and programs. Context metrics are rarer, making up only 4 percent of all metrics.
The most frequently used metrics are:
- Number of volunteers
- Number of clients served
- Total number of volunteer hours contributed to the organization
- Total dollar amount of grants awarded
- Number of participants engaged in programs
- Number of Facebook followers
- Number of students enrolled
- Number of meals served or provided
- Number of animal adoptions
- Number of animals rescued
Metrics are trending in the right direction. When Platinum Seal holders share a metric, they indicate how they would like to see each metric change over time: does success mean that a metric increases, decreases, or stays the same? Often, organizations want to see metrics increase, whether it’s to see more students graduate, or more animals adopted. The vast majority of metrics fall in this category. But success can also mean that a metric decreases—when fewer children go to bed hungry or student absenteeism drops. Comparing organizational data from 2019 and 2020, 52 percent of metrics that were intended to increase did, in fact, increase. And 66 percent of metrics that were intended to decrease actually decreased.
Conclusion
The nonprofit sector is complex, varied, and difficult to evaluate. We believe there is no single standard with which to understand effectiveness, but increased transparency will benefit the entire sector. The Platinum Seal allows nonprofits to share the data that matters the most to them. You can join the more than 12,000 nonprofits that have earned a Platinum Seal and demonstrated a commitment to sharing their results. It’s not too late to get started. Join a free webinar on September 15 to find out how to earn a 2021 Seal of Transparency. And learn more about what we know about Seal holders, overall, here.
Analysis of Seal holder data was conducted by Carol Brouwer.
About the author

Related posts

Co-leadership: A path to more diverse, sustainable nonprofits?
Dig into insights on nonprofit co-leadership to find out whether this commonplace trend of charitable organizations led by two leaders is opening the door to more overall diversity in the sector.
April 17, 2024

Youth community service: Belonging, reciprocity, and agency
Get insights into how young community service is being redefined by Gen Z and how young people are seeking to maximize their social impact—both for themselves and the communities they serve.
April 16, 2024

Connecting the dots: Fighting for equity through a data partnership
Elizabeth Barajas-Román of WFN shares what a demographic data partnership with Candid enables for advancing equity in the sector, including the first-ever, public dashboard to analyze intersectionality in nonprofit executive leadership.
April 11, 2024

The Maui wildfires: A record in disaster philanthropy, an opportunity to ‘get it right’
CEP’s Tanya Gulliver-Garcia explores funding for Maui wildfires—and what learnings the record-setting response to Hawaii’s recent natural hazard hold for future investment in disaster philanthropy.
April 9, 2024

Collecting demographic data: Nonprofits value transparency but need support
Viewpoint Consulting’s Kelly Brown shares new research findings on sharing demographic data via Candid, including the drivers and barriers of collecting this information to advance nonprofit transparency.
March 28, 2024
What’s trending? Top subject searches in Candid nonprofit profiles
Candid nonprofit profiles help funders, donors, DAF advisors, and others find organizations to support; read this article to learn what supporters searched for most in February 2024.
March 27, 2024